Building a faster safe-area feedback loop for Capacitor
While working on Capacitor apps, I noticed that frontend developers could easily overlook the space needed around a phone’s notch or home indicator. Hybrid apps built around a WebView let you use HTML, CSS, and JavaScript to build iOS and Android apps. You can do most of the UI work in a desktop browser, but getting these mobile layout details right can be time-consuming.
I thought I could build a simple preview fairly quickly, especially with help from AI agents. That would let me test whether it could reduce the time spent adjusting the UI for mobile. My team wasn’t interested, so I built Capacitor Chrome Preview for myself after hours.
What I wanted to make visible
Chrome’s Device Mode doesn’t show a home indicator, notch, or status bar. Overriding the CSS safe-area values would cover most of what I needed for layout work. I could then add styles to make the preview look more like an actual phone.
I also wanted a small set of iPhone and Android profiles based on the devices I use for everyday development. That would let me quickly switch between an iPhone with a notch or the Dynamic Island, and Android devices with three-button or gesture navigation.
Choosing how to control Chrome
I considered a browser extension and tested a few. They were easier to install, but awkward to use regularly, and some didn’t do what I needed. For a tool used alongside a terminal and a local dev server, easy installation wasn’t much of an advantage.
The Chrome DevTools Protocol, or CDP, gave me a way to send commands to
Chrome and inspect the result. An extension can use it through
chrome.debugger,
but that comes with restrictions. I chose a CLI to control a dedicated Chrome
session directly. This gave me more flexibility and kept the preview separate
from my everyday browser.
Controlling the page viewport
Getting the page to the right size was another challenge. Browser UI and
docked DevTools take up part of the window. I used Chrome’s app mode to give
the page its own window, with two CDP calls controlling its size.
Browser.setContentsSize
resizes Chrome’s actual content area by changing the app window.
Emulation.setDeviceMetricsOverride
changes the virtual viewport and device scale factor reported to the page.
With these settings, the emulated layout viewport stays fixed even when I resize the Chrome window. I could use this for basic keyboard simulation in a future version, reducing the visible area while keeping the layout viewport fixed.
Writing and sending commands
CDP is absolutely great! I could use the same connection for viewport sizing, safe-area overrides, touch emulation, and much more than I’d expected.
For the hardware overlays and fallback CSS variables, I inject a small JavaScript runtime into the page. CDP accepts that JavaScript as a source string. Editing a large JavaScript string would be a nightmare. I kept the runtime in TypeScript functions so I could use type checking and VS Code’s syntax highlighting. When preparing the CDP request, I serialize the compiled functions into the source string Chrome receives. The controller installs this runtime before app navigation and reapplies it as needed after navigation.
Providing safe-area insets
The safe-area values come from
Emulation.setSafeAreaInsetsOverride.
It changes the browser’s env(safe-area-inset-*) values, so CSS that already
uses those values can respond without being rewritten for the preview.
The injected runtime draws the hardware overlays and sets custom properties
such as --safe-area-inset-top, matching the Android fallback used by
Capacitor’s System Bars API.
The notch overlay makes the preview look more like a phone, but doesn’t move
any content.
A small terminal UI with React Ink
I needed a CLI that was comfortable to use and easy to maintain. I was already familiar with React and wanted to learn something new, so I chose Ink, which renders React components in a terminal.
I was amazed by how simple the UI was to write and how convenient the finished CLI was to use. Ink listens for individual key presses, so I could interact with the preview without typing a command and pressing Enter for every action. It does bring a substantial set of dependencies to update and keep compatible.
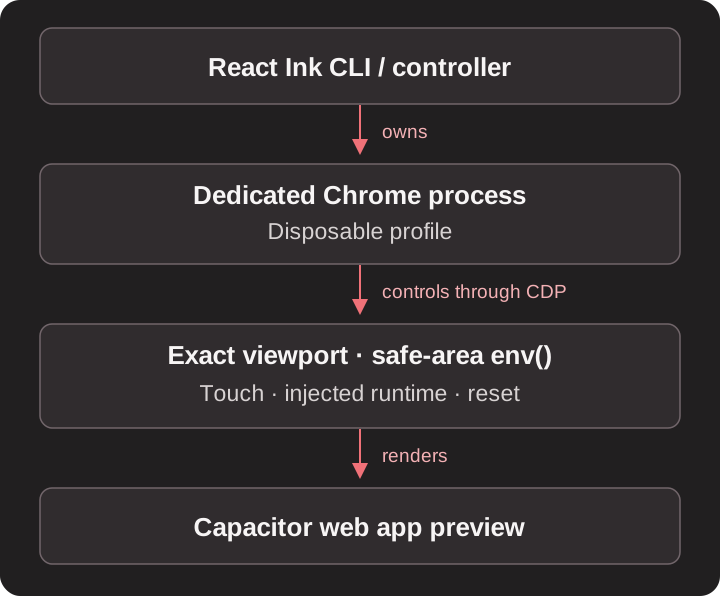
The final architecture looks like this:
Getting the device profiles close enough
For the device profiles, I wanted viewport and safe-area measurements I could collect myself. I built the Geometry Probe inside the project to gather them from physical devices, instead of relying only on values found online. It’s another tool to maintain, which I consider a minor cost.
Gesture bars, notches, and the Dynamic Island are visual approximations drawn within the measured system UI regions. For layout work, I care more about those measured regions than the exact shape of the drawings inside them.
Using it, then releasing it
I used the tool for real UI work for a few months before releasing it, to build confidence in it and fix issues along the way.
I then published the repository and released an npm package. Publishing my own npm package taught me a lot, including about the security measures npm has introduced in recent years to help prevent supply chain attacks. I came away more confident about releasing other tools under my own name.
There’s no need to overengineer it for now. If the tool proves useful, I’d like to simulate more native capabilities. I’m also considering a plugin system that would let projects provide their own substitutes.
The current release supports Google Chrome on macOS. The project README has the setup instructions if you want to try it with your own app.
Try CDP for yourself
I strongly encourage you to try CDP. It’s already in Chrome, and this project gave me plenty of reasons to keep exploring it. I wish I’d known about CDP earlier. It would have saved me some of the workarounds I built.
For a focused, Chrome-specific problem, direct CDP can be much handier than starting with a larger abstraction. Playwright can connect to Chromium over CDP, and Cypress uses CDP for parts of its Chromium automation. Chrome DevTools MCP also makes DevTools capabilities available to coding agents.
You can also use CDP to inspect and automate pages in Chrome on an Android device. On iOS, Safari’s Web Inspector is another route to explore for remote inspection of web content.
The Protocol Monitor in Chrome DevTools lets you watch the commands DevTools sends and send your own. Open it while doing something repetitive in DevTools and see which commands you could use.